// blog
A Report's Measurements, Drawn on the Scan: DICOM SR in Your Browser
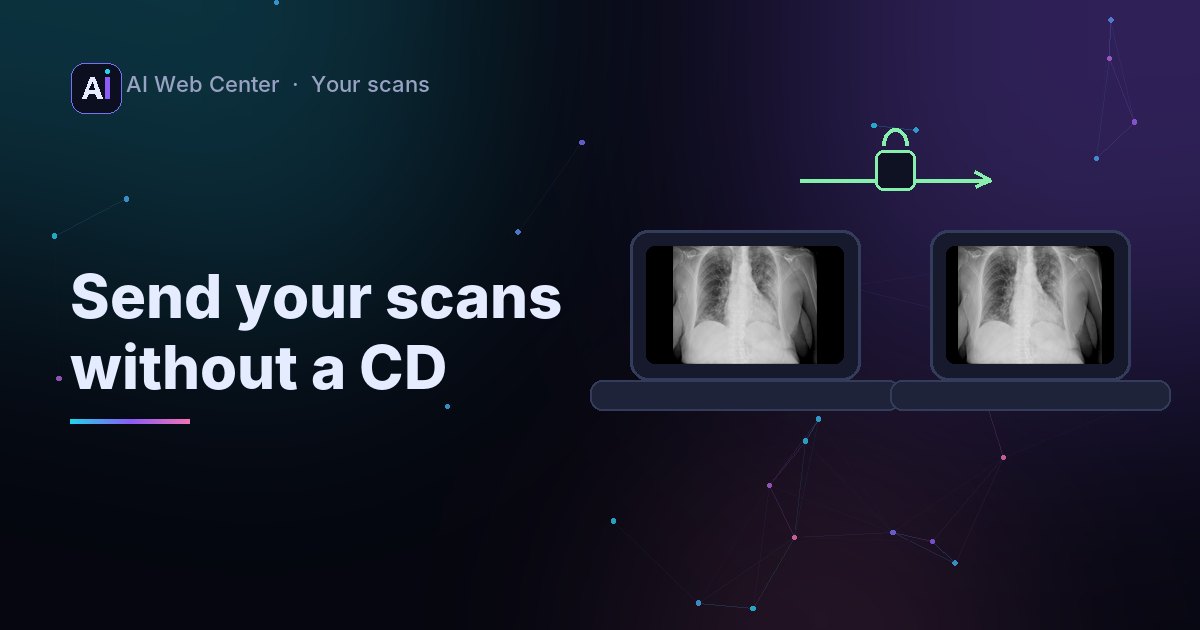
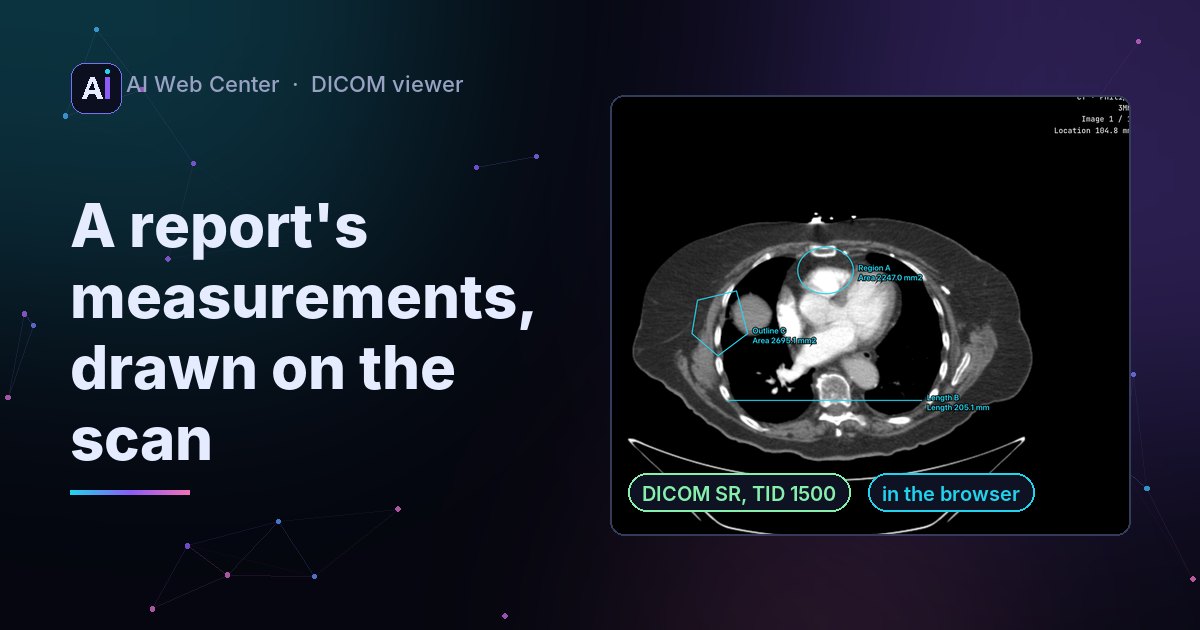
Our free DICOM viewer now opens structured reports together with their images. A measurement report (DICOM SR, template TID 1500), from a person or an AI tool, is listed beside the images, and each of its shapes is drawn on the image it names, in cyan, with its name and value. Shapes stored in the patient’s 3D coordinates are placed on the image in their plane. A key-object note lists the images it picked, with Previous and Next. The full report can be read over the image, with links back to each shape. From a PACS, an image series brings the reports that point at it. Everything is read in the browser.
AI tools that measure on scans often save their results as a DICOM structured report, an SR, next to the images. A doctor opens the CT and the measurements are, in principle, right there. In practice many simple viewers skip the file, or show it as a wall of text.
Our free DICOM viewer now draws them on the scan.
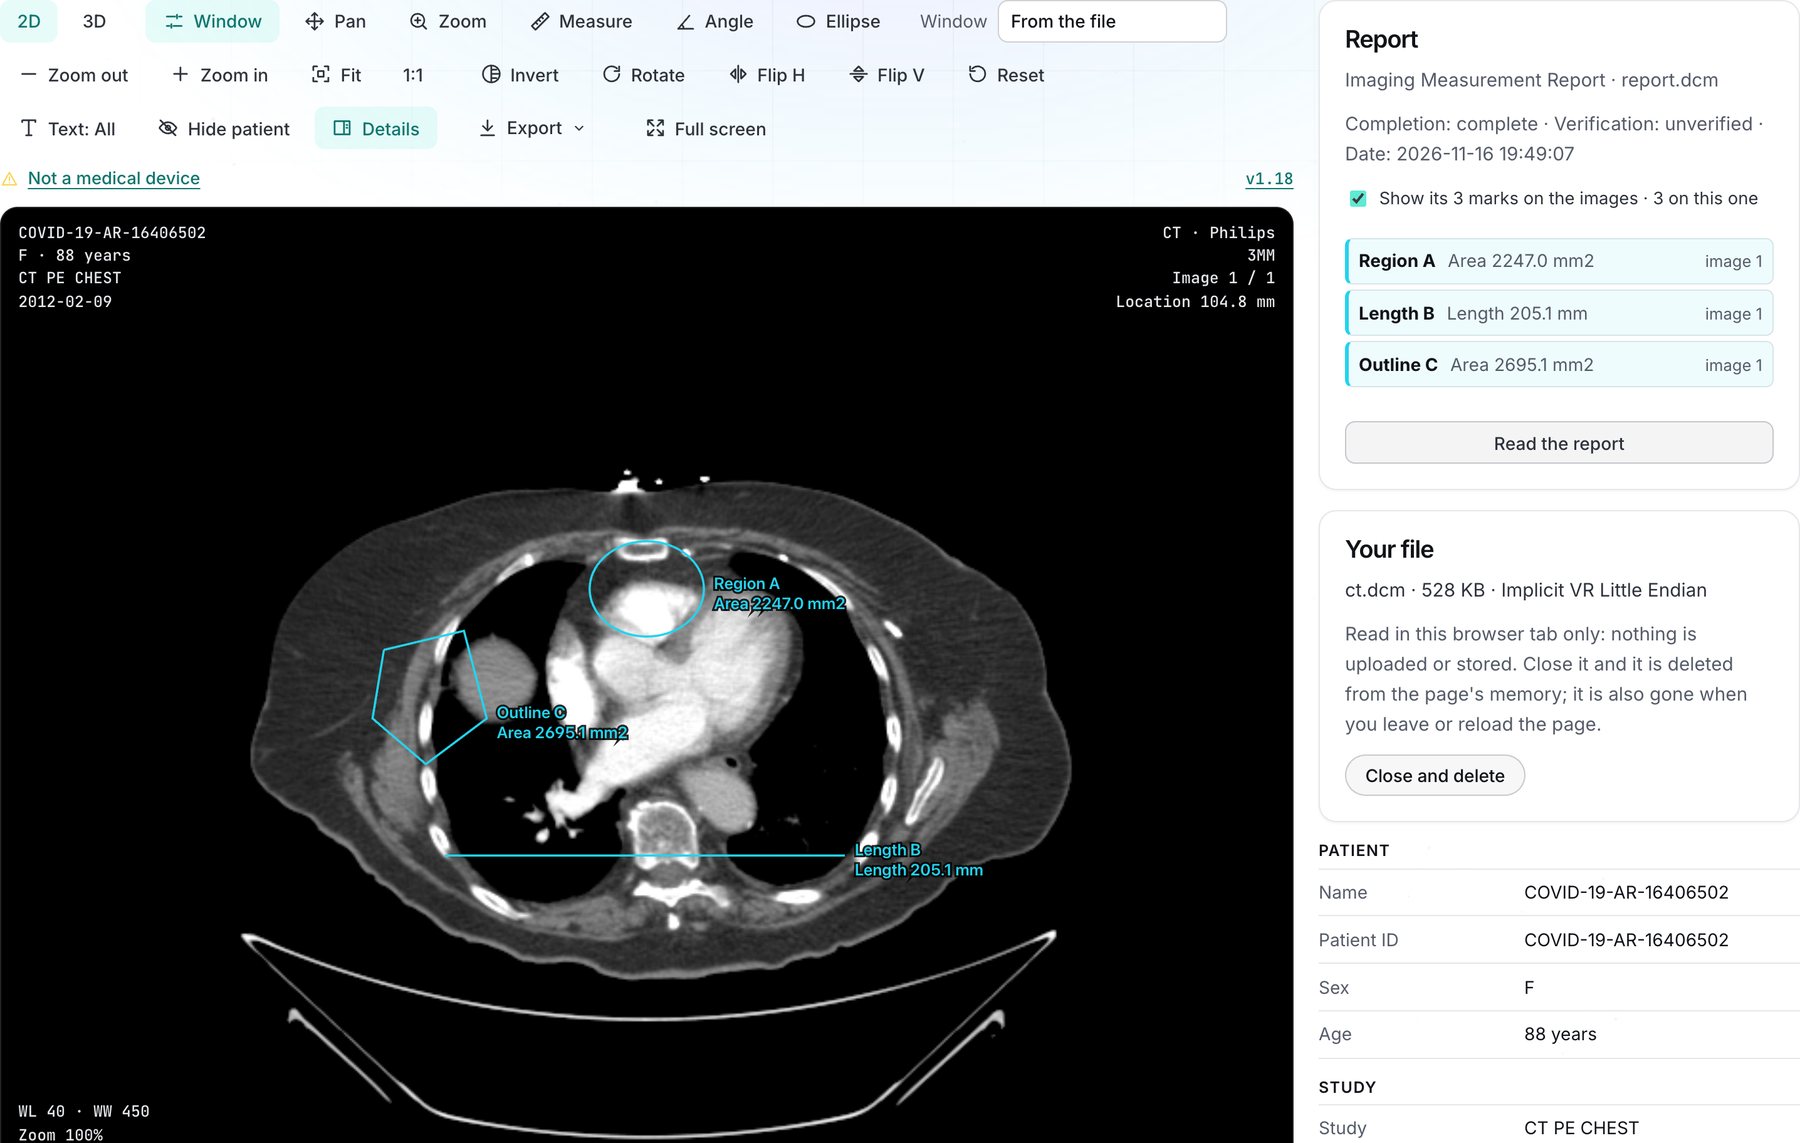
A test report we wrote with highdicom, an independent open-source library, on the Chest CT sample.
What it does
Open the report together with its images: drop them on the viewer, or open the series from a PACS.
- The Report card beside the image lists every measurement with its value and the image it’s on. Click one to go there.
- On the image, each shape is drawn in cyan with its name and value: lengths, outlines, ellipses, circles and points. Your own measurements stay yellow.
- 3D shapes. A shape given in the patient’s coordinates instead of an image’s pixels is placed on the image in its plane.
- Key images. A key-object note shows the images it picked, with Previous and Next.
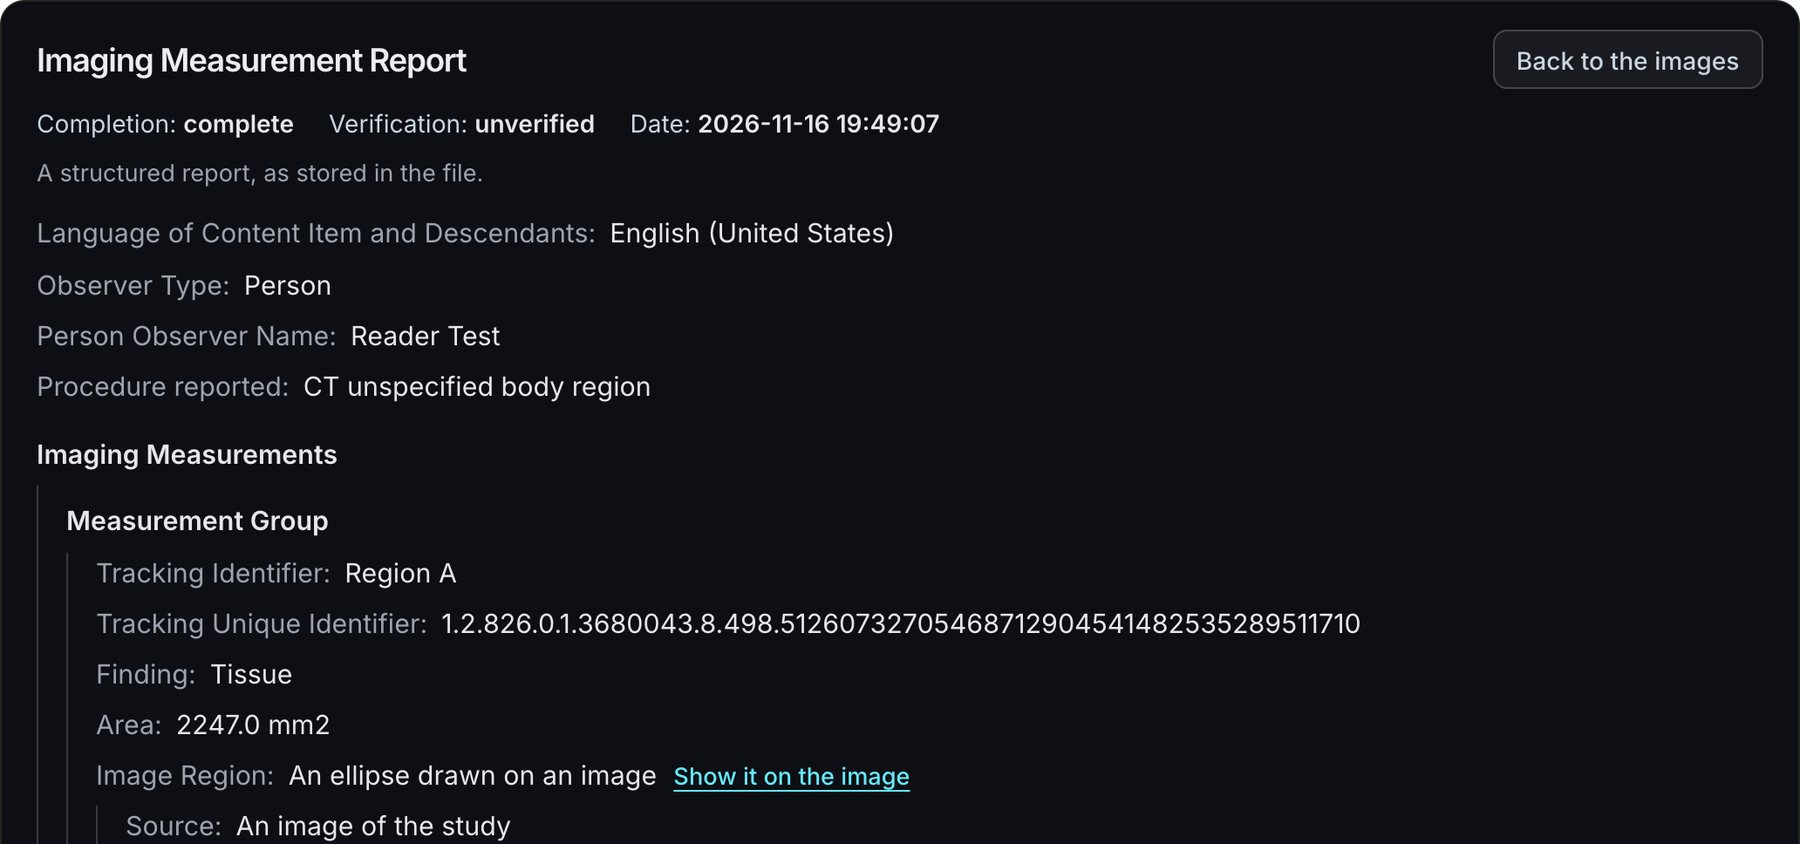
- Read the report opens it over the image, as stored. Each shape in it has a Show it on the image link, and Back to the images closes it.
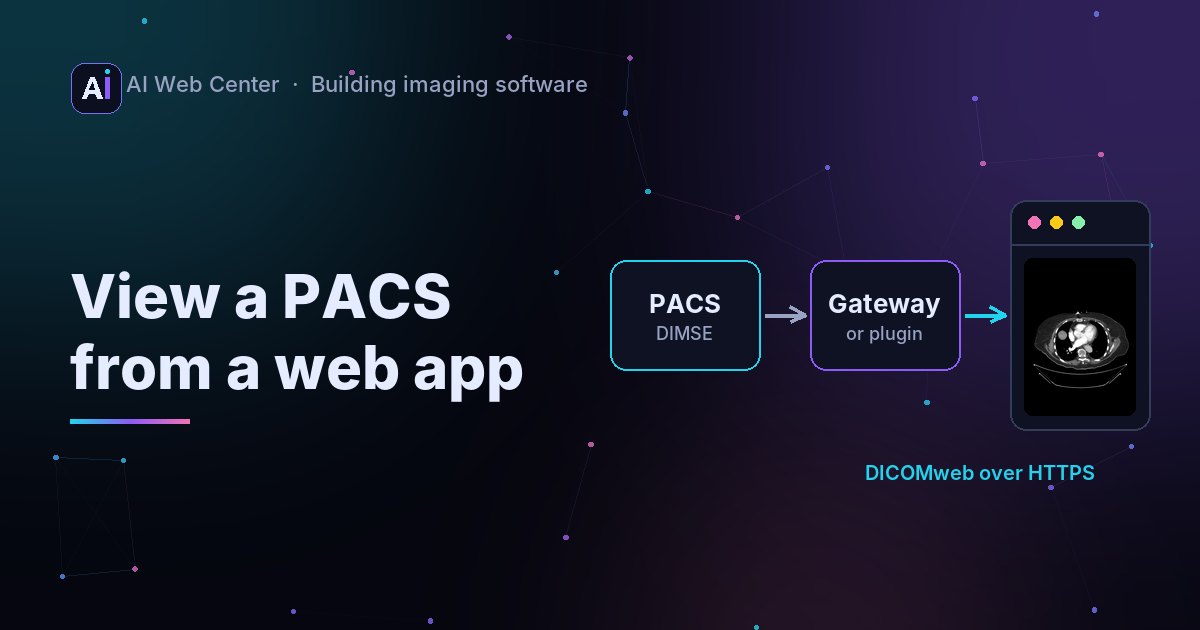
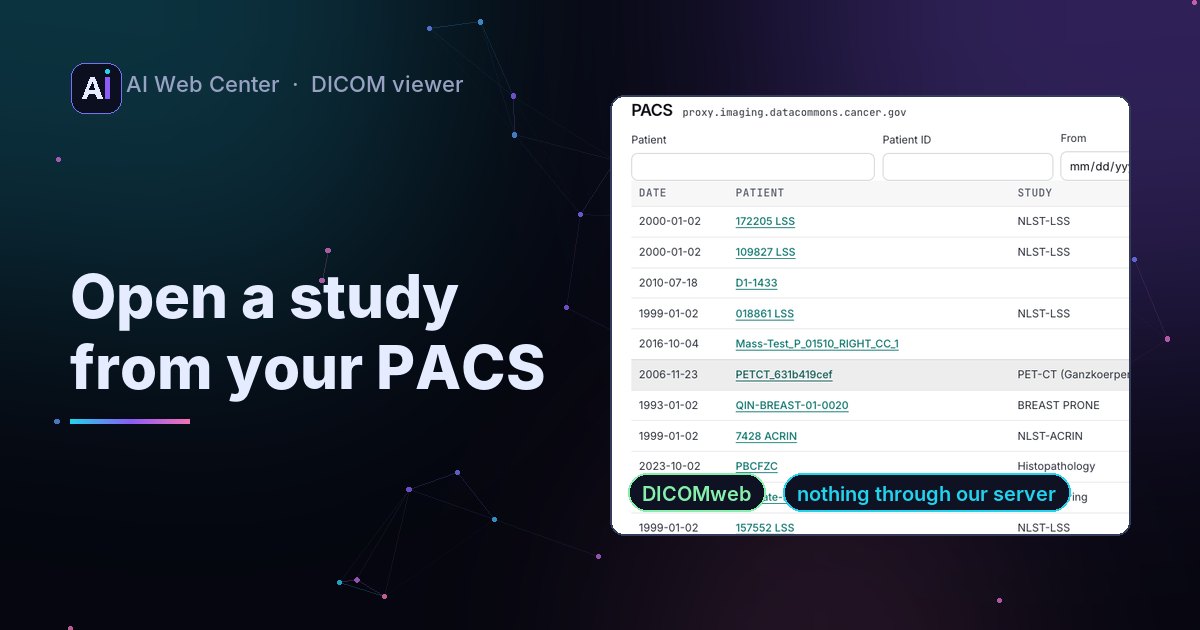
- From a PACS, opening the images brings the reports that point at them, and opening a report brings its images.
- Export to PNG or JPEG keeps the shapes.
Why it matters
Measurements that sit in a separate file are easy to miss. When the report opens with the images and every value sits on the spot it measures, people can check it in seconds. A list of numbers takes much longer to check.
We checked the viewer against reports it didn’t write: test reports made with highdicom, an independent open-source implementation of the templates, and the DCMTK test reports in pydicom’s test data. In the tests, each highdicom shape lands on the right image at the right pixel, including outlines given in 3D.
Try it
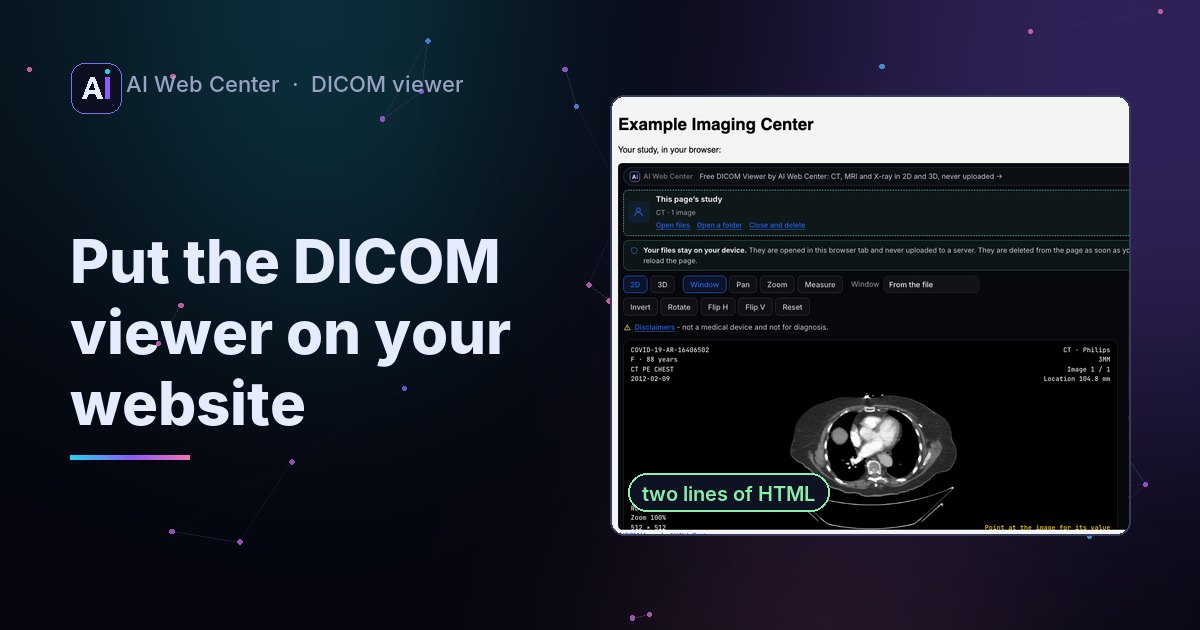
Open the DICOM viewer and drop a report together with its images, or open a study from your PACS. Everything is read in your browser and nothing is uploaded.
Private, and only a viewer
The viewer shows what a report contains. It doesn’t check whether the measurements are right. It’s a technology demonstration, not a medical device.
Adding AI results to your imaging portal or product? Tell me about it.
Frequently asked questions
What is a DICOM structured report?
A DICOM file (modality SR) that holds a report as a tree of coded items: what was measured, the value and unit, and the shape drawn on an image. TID 1500, the Measurement Report template, is the one AI tools and viewers use for measurements.
What does the viewer draw?
Each shape in the report: lengths, outlines, ellipses, circles and points on the image they name, and outlines given in the patient's 3D coordinates on the image in their plane. Each is drawn in cyan with its name and values, apart from your own measurements in yellow.
What is a key-object note?
A small DICOM file (Key Object Selection) that marks images worth looking at, often with a title like "Of Interest" and a description. The viewer lists those images and steps through them.
Does it work with a PACS?
Yes. Opening an image series from a PACS also brings the reports and documents that point at it, and opening a report brings its images.
Does the viewer check whether the measurements are right?
No. It shows what the report contains. It's a technology demonstration, not a medical device.